AWstats is a popular server log analyzer included with cPanel. It can be used to generate a wide variety of traffic reports allowing you to understand who is visiting your website, when they are visiting and which pages they visit the most.
• Average monthly, daily and hourly visitor numbers
• The links through which visitors access your website
• HTTP codes
• Visitor operating systems
• Browser information
• Visitor location
To access AWStats follow these instructions.
Login to cPanel.
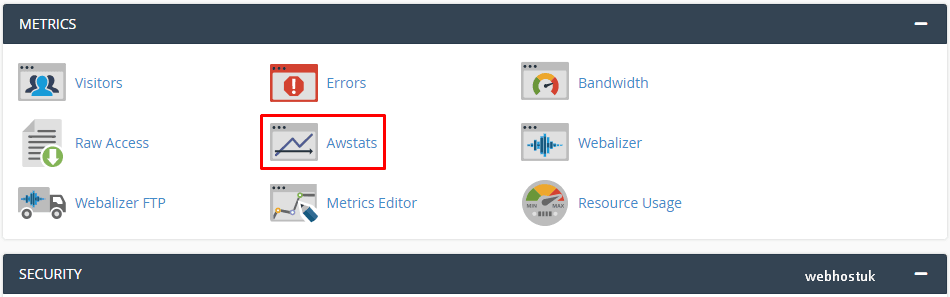
Scroll down to the Metrics section and select the AWstats icon to proceed.
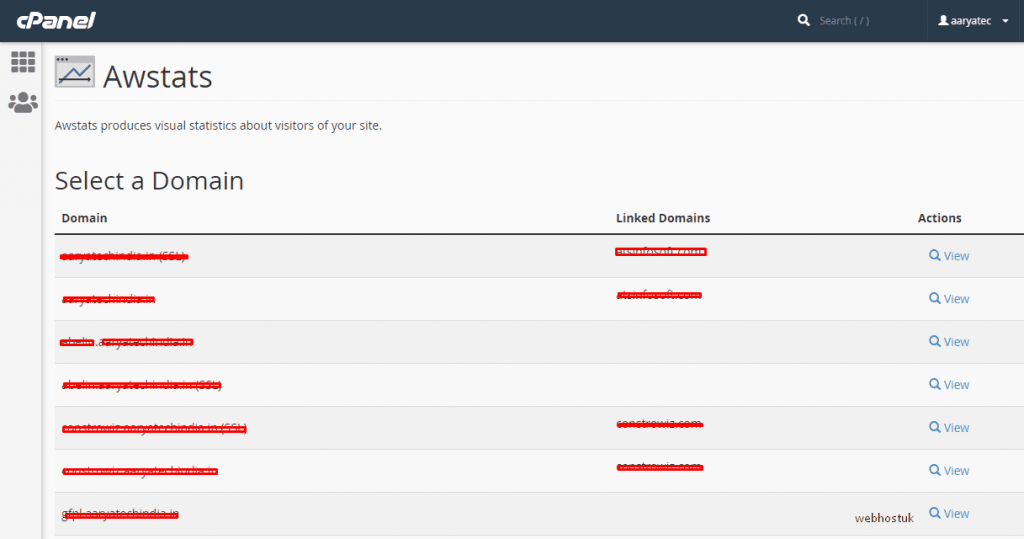
Click the view icon for the domain whose statistics you wish to see. The statistics will then be displayed.
A detailed glossary of the information provided by AWStats can be found at https://awstats.sourceforge.io/docs/awstats_glossary.html
The AWstats Summary page
The main AWstats interface will open at the Summary page, displaying the following details about your website’s visitors:
- Unique visitors
- Number of visits
- Page impressions
- Page impressions per visit
- Hits
- Bandwidth downloaded
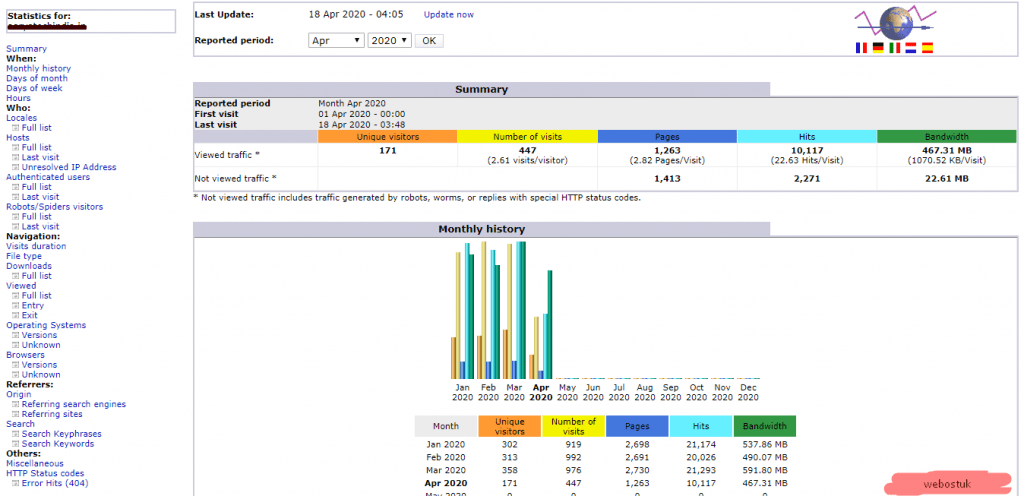
You’ll see stats for both Viewed and Not viewed traffic. The latter includes traffic generated by robots, worms, or replies with special HTTP status codes.
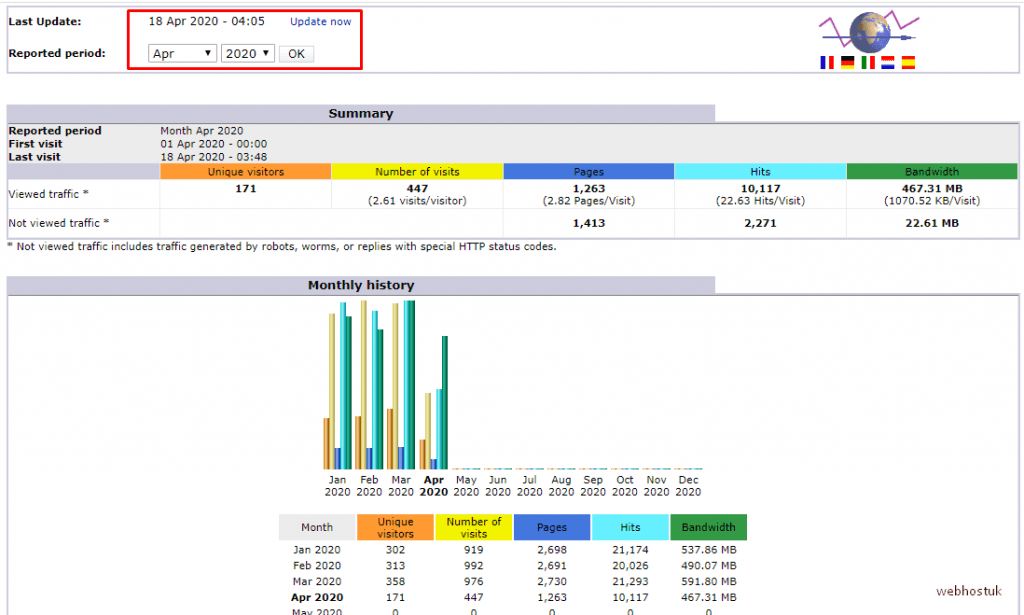
Statistics are updated on a daily basis – you can see the date and time of the latest update at the top of the page. By default, you’ll be presented with a report for the current month. Use the dropdown menu at the top of the page to view the report for previous months.
Scroll down the summary page to see a wealth of information about your visitors. Summary traffic reports are aggregated by:
- Month
- Days of month
- Days of week
- Hours
- Locales (Top 25)
- Hosts (Top 25)
- Authenticated users (Top 10)
- Robots/Spiders visitors (Top 25)
- Visit duration
- File type
- Downloads
- Operating systems (Top 10)
- Browsers
- Search keywords and keyphrases
- HTTP Status codes
Navigating AWstats
You can navigate through an extended range of reports using the left sidebar. Some of these links are shortcuts to the summary reports listed above. However, a number of links allow you to drill down into the logs, generating deeper insights into your traffic and visitors. They include:
- Locales – a full list of visitor countries, ranked by page impressions, with hits and bandwidth metrics.
- Hosts – a report showing full details of visitor IP addresses, with date stamps, page impressions, hits and bandwidth.
- Authenticated users – users who have logged in to a password protected area of your site.
- Robot/Spiders visitors – a list of web crawling robots that have visited the site, commonly used by Google, Yahoo, Bing and other service providers.
- Downloads – a full list of files that have been downloaded on your site.
- Viewed – a full list of URLs visited by website users. Metrics include page impressions (viewed), the average page size (in kilobytes or megabytes), and entry/exit statistics (useful for identifying your most common landing pages or exit URLs).
- Operating Systems – detailed statistics on the operating systems being run by devices used to visit your website (handy for identifying mobile and desktop traffic).
- Browsers – detailed statistics on the web browser applications used to visit your website
- Referrers – search engines and websites that link to your content and send traffic to your website.
- Search – a full list of search phrases and keywords used to identify and link to content on your website. This analysis is useful to understand what your users are seeking when visiting your website and can support a strong SEO (search engine optimization) strategy.
- Errors – a list of pages that are currently generating errors when visited. Identifying and resolving these errors promotes a better user experience and will improve your standing with search engines.
Once you’ve mastered the basics of web traffic analysis with AWstats, you can progress to more comprehensive tools such as Google Analytics.